Examples
If properly installed, DigiPlot can be run by simply entering digiplot at a command prompt/ terminal window.
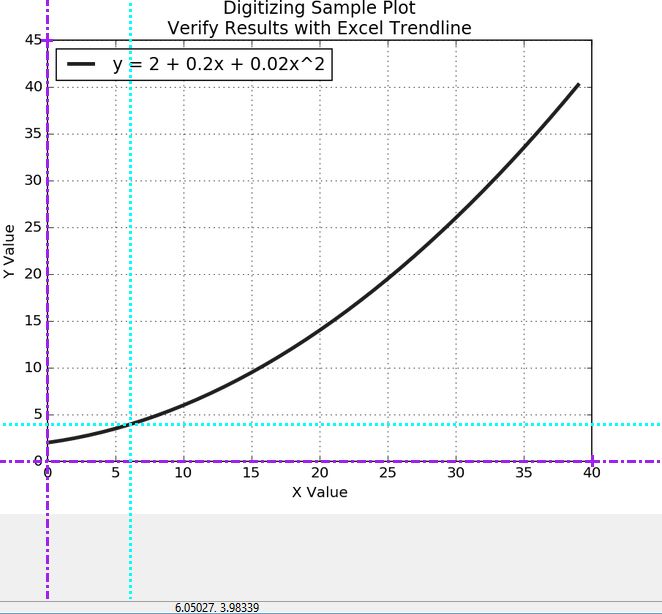
Sample Plot
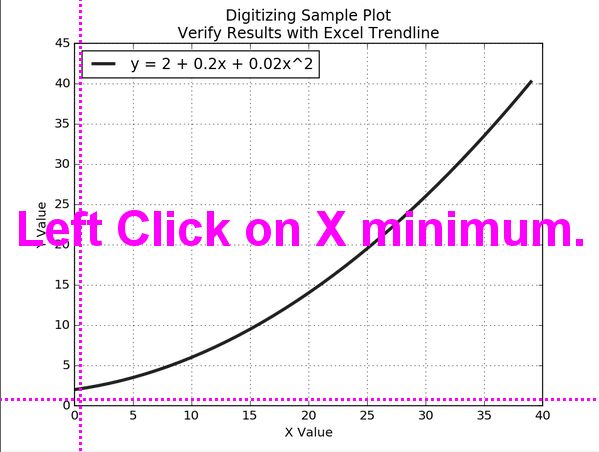
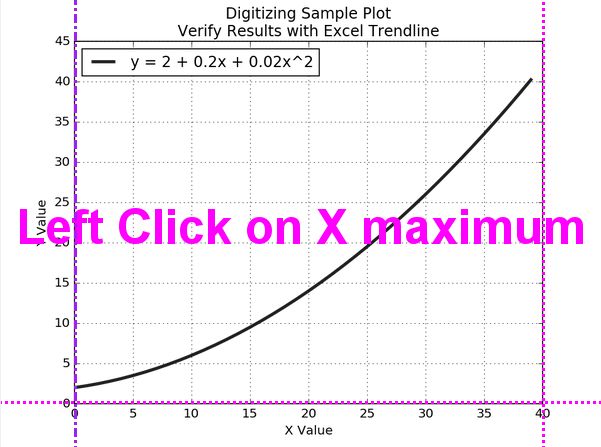
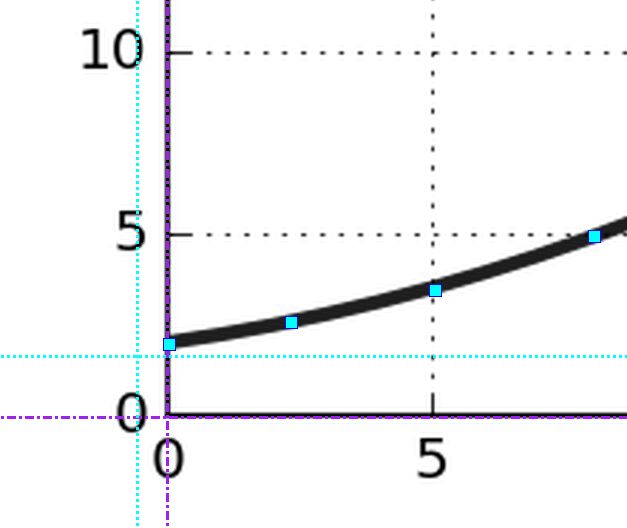
When DigiPlot starts, it displays a Sample Plot of a polynomial (y = 2 + 0.2x + 0.02x^2).
The first time you run DigiPlot, it is recommended that you practice with the sample plot in order to get familiar with the code. After digitizing the sample plot, you can copy and paste the data into a code like Microsoft Office Excel or Libre Office Calc and fit a polynomial trend line to see how well the digitize process can work. My results are shown below.
My Results of running DigiPlot on the Sample Polynomial Plot.
y = 1.99928677837 + 0.201139355161*x + 0.0199798904881*x**2

    Correlation Coefficient = 0.999997115772
    Standard Deviation = 0.0293109315872
    Percent Standard Deviation = 0.438930620106%
| Excel Output | OpenOffice Output |
|---|---|
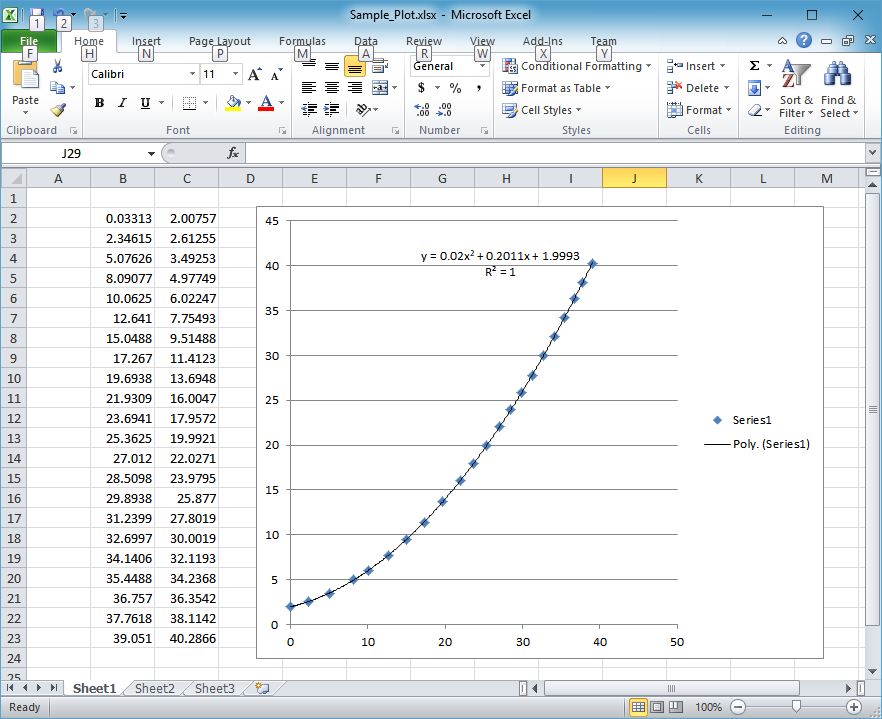
|
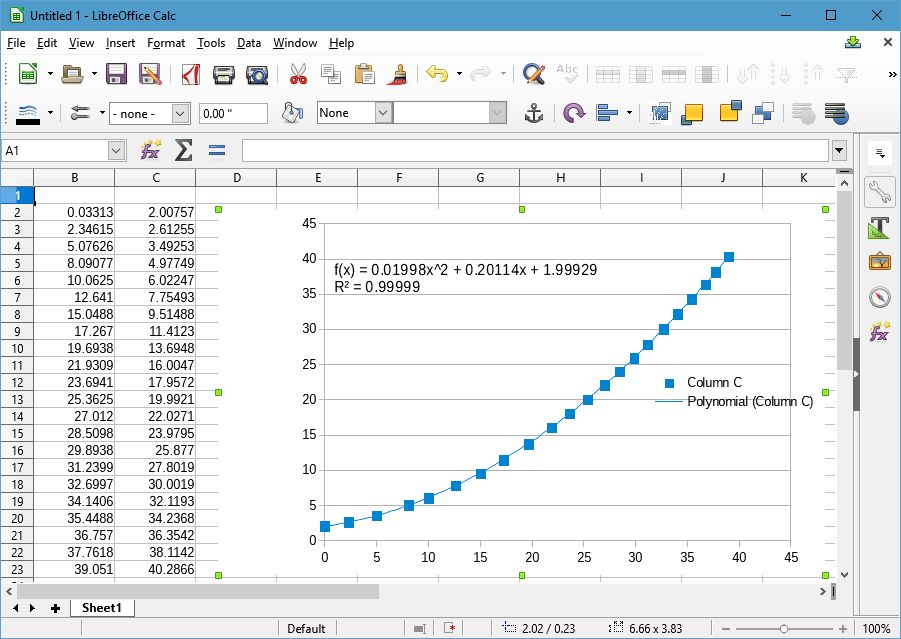
|
Click images to see full size
Define Plot Axes
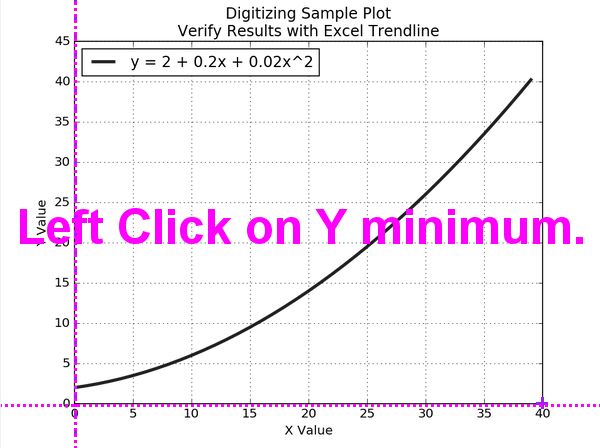
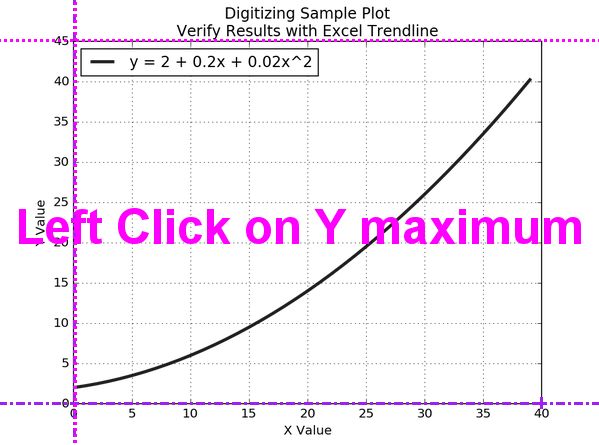
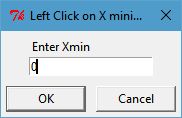
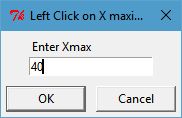
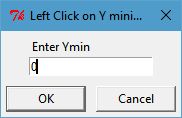
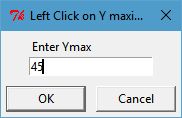
The first task of digitizing the plot is to define the axes. DigiPlot prompts you to click the four defining points on the plot.
Place the cross-hairs on each plot point in turn, left click and enter the numeric value in the pop-up dialog box.
The process of defining axes is shown below for the Sample Plot
| Click Xmin | Click Xmax | Click Ymin | Click Ymax |
|---|---|---|---|
|
|
|
|
|
|
|
|
Click images to see full size
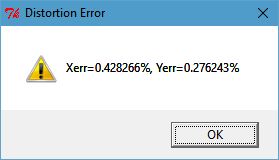
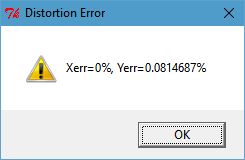
Distortion Error and Zoom
After defining the axes, a Distortion Error information box appears. It is an indication as to how closely the X and Y axes conform to orthogonality. If the image iteself is not distorted, then some improvement can be gained by zooming in on the plot using the mouse wheel.
Zoom in to Improve Distortion Error
Zoom using the mouse wheel
Pan by dragging the right mouse button
| Distortion | Zoom | ||||
|---|---|---|---|---|---|
|
|
Click images to see full size
Pick Points on the Plot
Select points on the plot by placing the cross-hairs on the point and left clicking the mouse. Notice that the Status Bar will reflect the X and Y values that the cross-hairs are over.
Note
Using Zoom will improve your accuracy
| Left Click to Select Points |
|---|
|
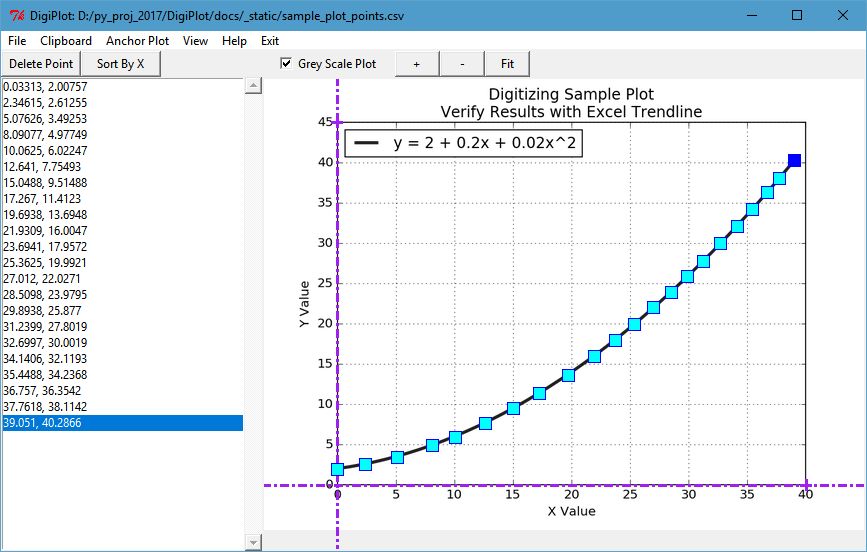
Modify Selected Points
The list box on the left side of the screen contains the selected points.
You may delete a point by selecting it in the list box and clicking the Delete Point button.
Notice also, that you can sort the points by increasing X value by clicking the Sort By X button.
| List Box Shows Points |
|---|
|
Click images to see full size
Save to File or Clipboard
Typically, the goal of digitizing a plot is to simply get the data into another application. It is recommended that after the X,Y data is generated, that you save it to a CSV file using the File/Save CSV option.
It is often also convenient to simply place the data onto the clipboard and paste it into an application like Microsoft Excel or Libre Office Calc. The Clipboard/Comma Separated (CSV) or Clipboard/Tab Separated (Excel) are useful for that.
Note
Pasting two columns into Excel requires TAB separated data NOT Comma separated.